Command Palette
Search for a command to run...

About the Project
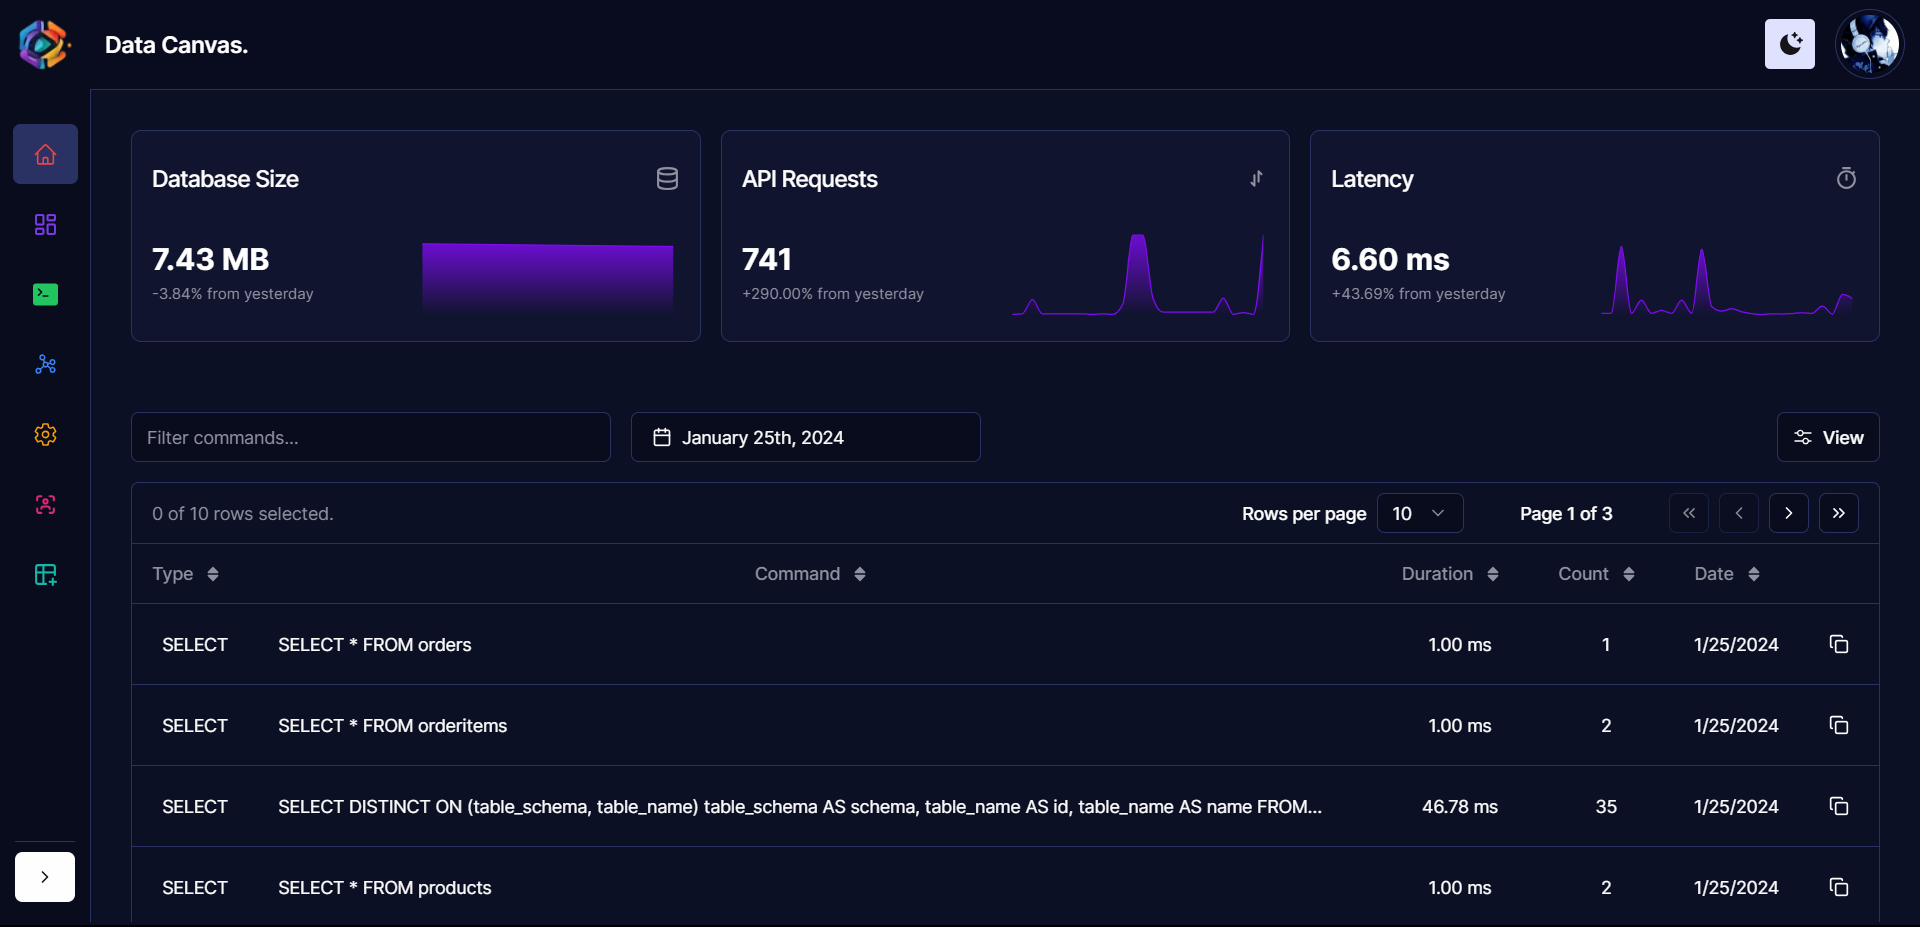
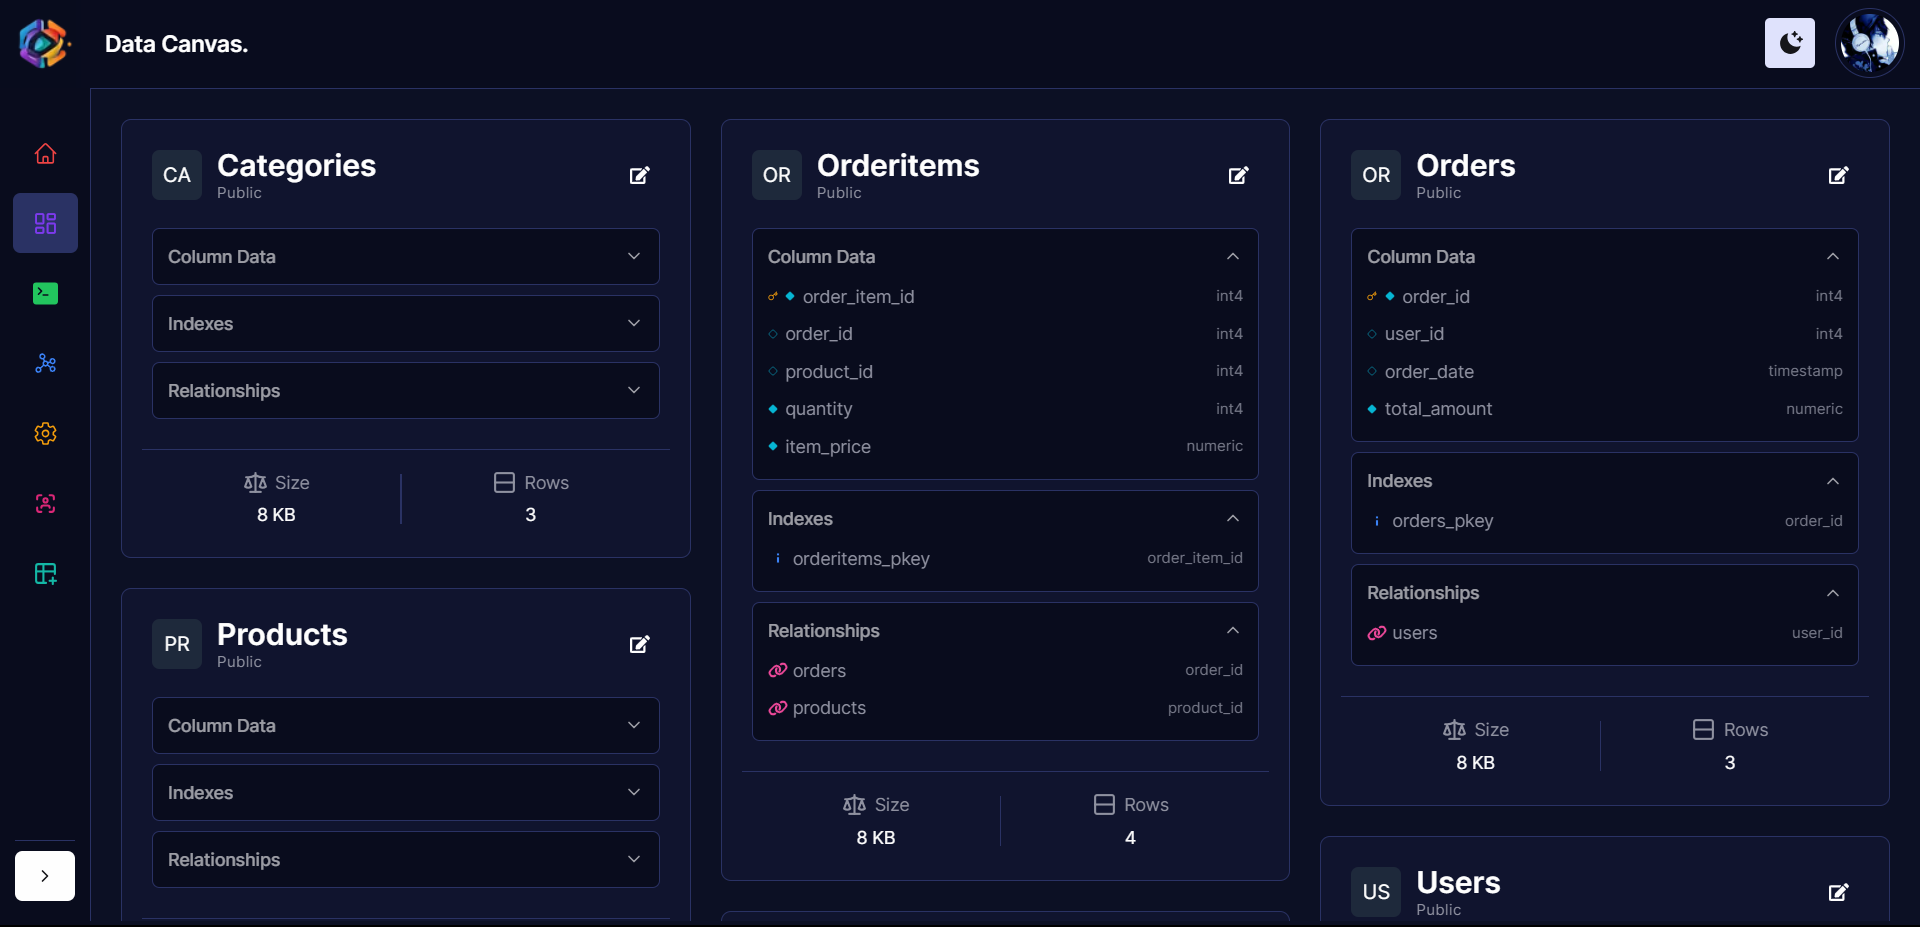
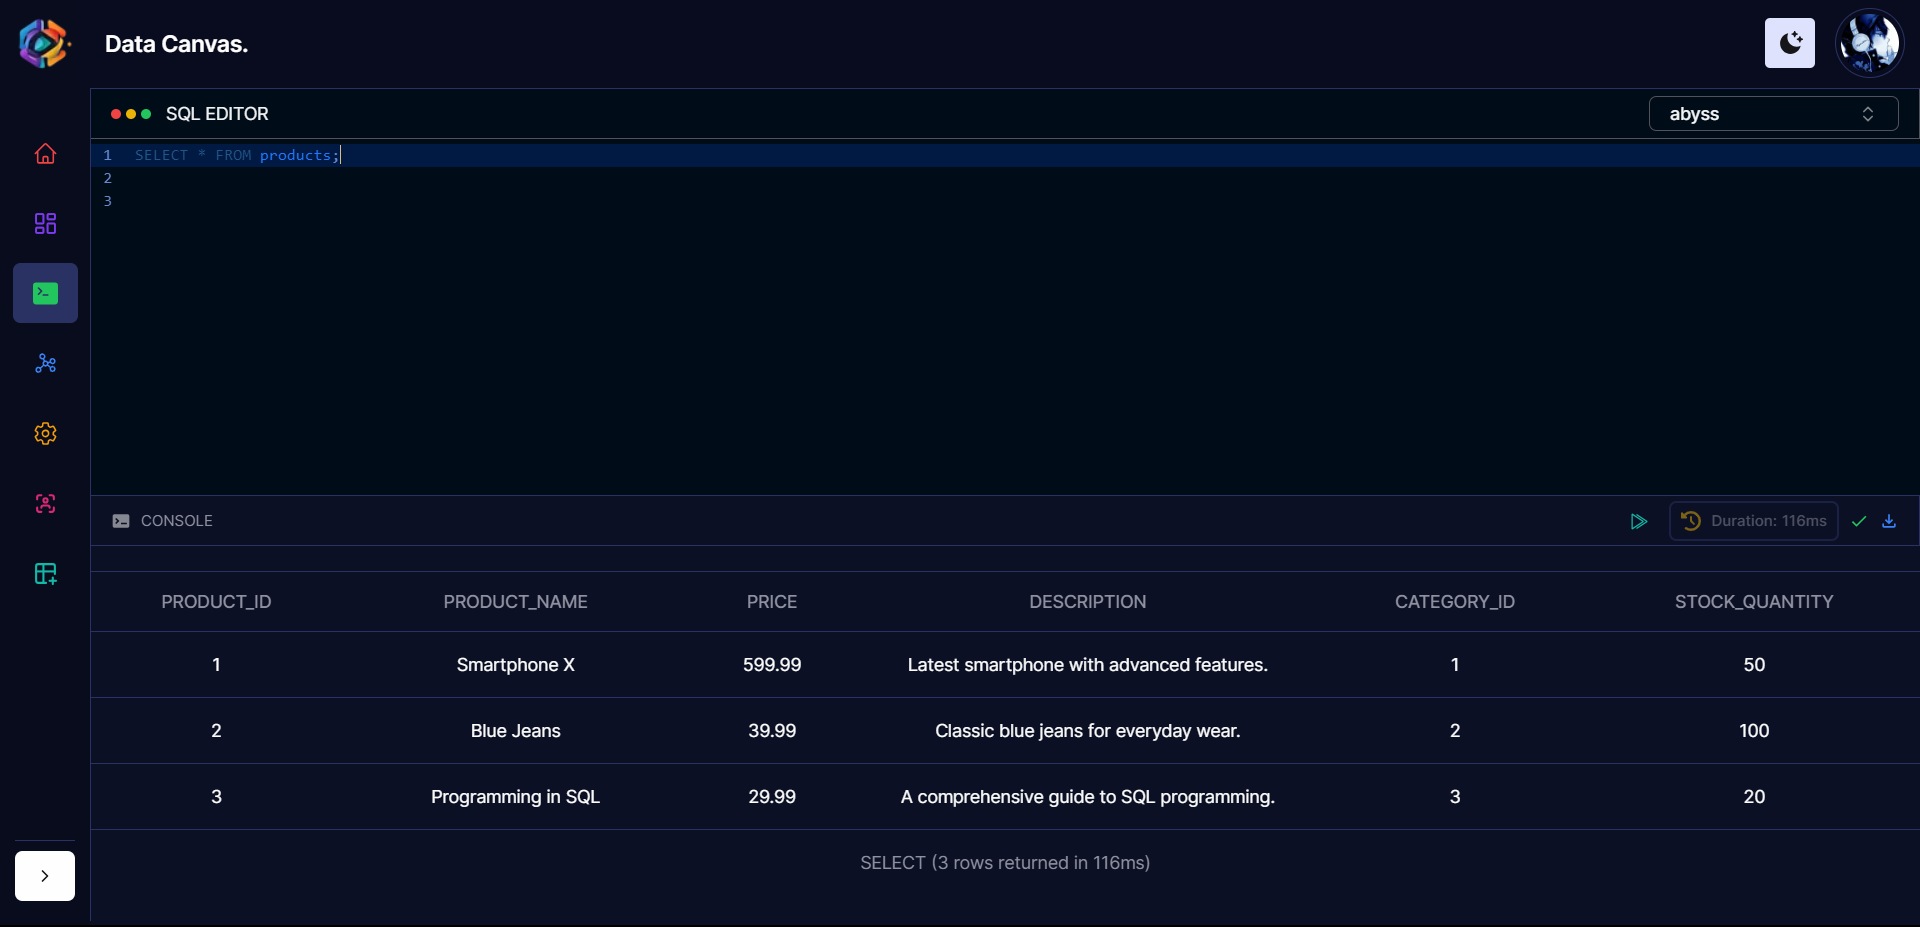
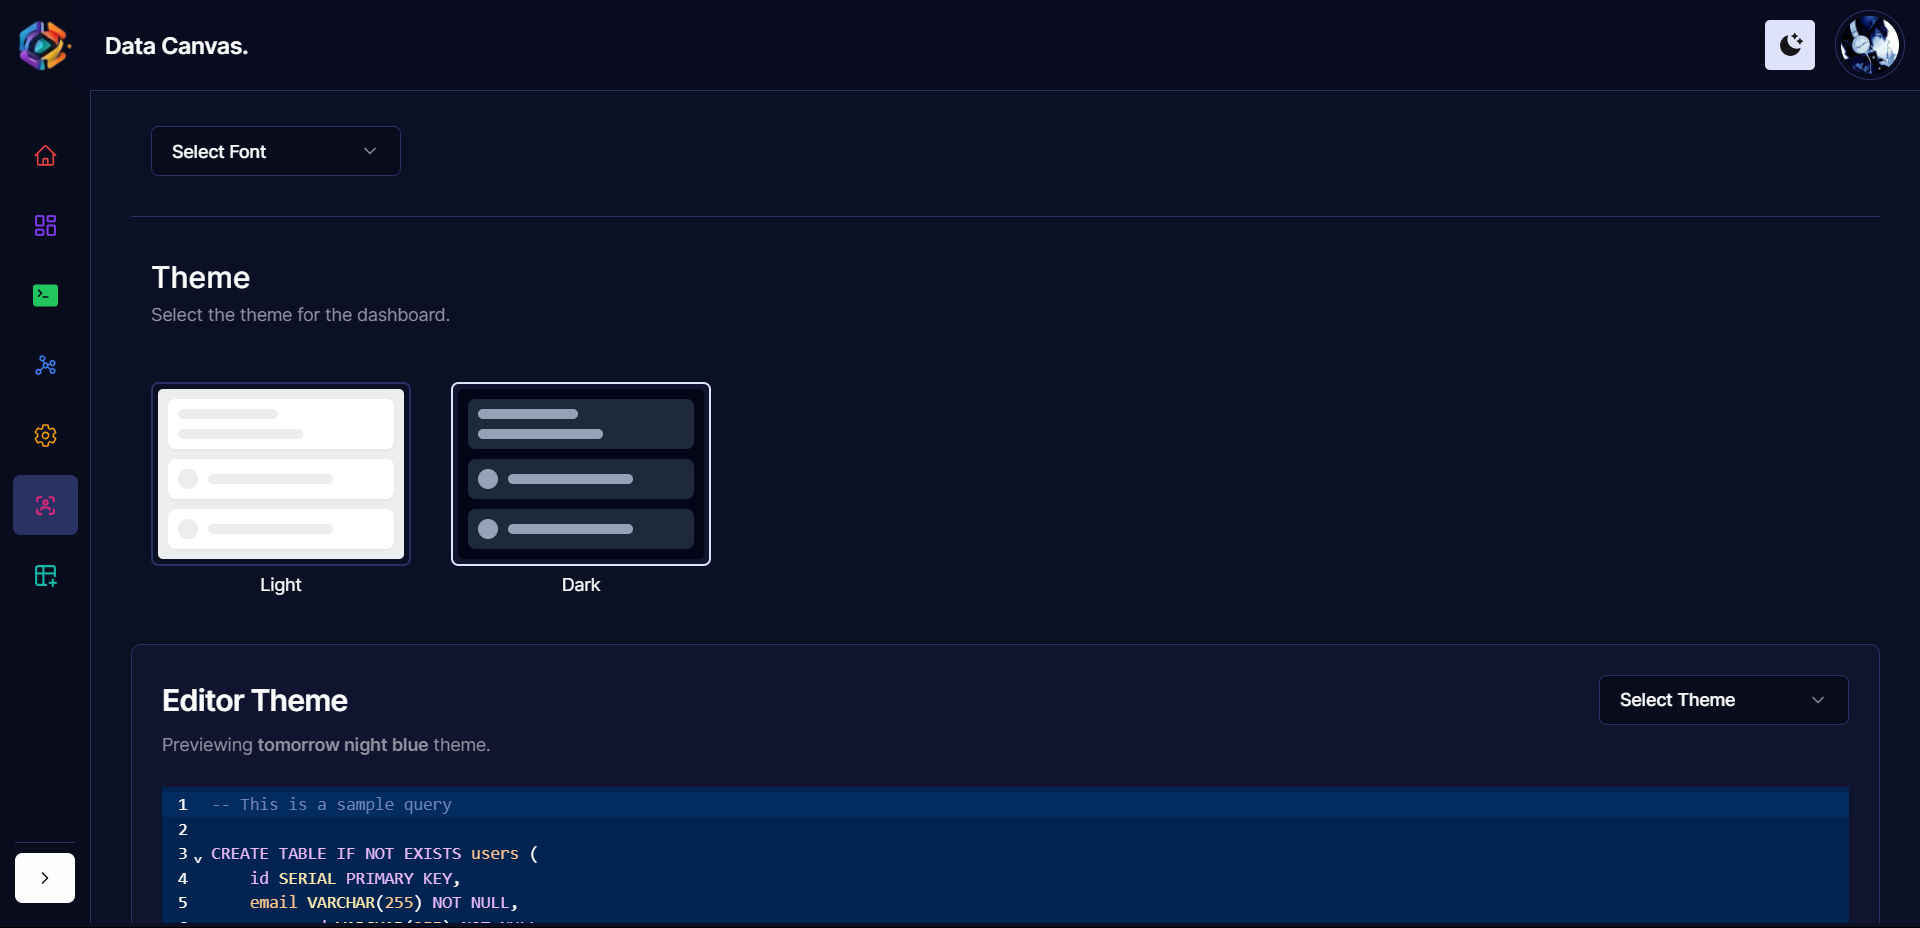
This web-based data management and visualization tool simplifies database interactions with a modern, responsive UI and powerful real-time analytics. It offers intuitive schema visualization, an online SQL editor, and real-time logging to monitor queries and performance. Users can manage, edit, and export table data effortlessly while integrating external applications via API credentials. Customizable themes and layouts enhance usability. Built with Next.js/React for the frontend and leverages Next.js api routes and server actions for the backend.
Key Features
- •Modern and responsive UI
- •Real time user and database logs and statistics
- •Table Schema visualization and Management
- •Online SQL query editor
- •Graph Schema visualization
- •API credentials for external applications
- •Theme and Font customization
- •Table Data Visualization and Management
- •Export table data and schema as CSV and PNG
Screenshots